Middle East Danger Zones: A 2026 Update
Shimshon Bichler and Jonathan Nitzan [1]
Jerusalem and Montreal, March 2026
![]() bnarchives.net / Creative Commons (CC BY-NC-ND 4.0)
bnarchives.net / Creative Commons (CC BY-NC-ND 4.0)
Danger Zones
In February 2026, the United States and Israel attacked Iran, kickstarting a new Middle East ‘energy conflict’. And like most energy conflicts over the past half century, this one too began after the region fell into a ‘danger zone’.
The notion of a danger zone was first introduced in our paper, ‘Bringing Capital Accumulation Back In’ (Nitzan and Bichler 1995). We coined it to denote a period in which the Middle East is likely to experience an oil-related conflict or war and examined its implications for the region’s global political economy.
Capitalism, we argued in our research, was a regime built on the capitalization of power, organized through relative pecuniary quantities and ruled by state-backed, dominant-capital coalitions. In line with this approach, we proposed that, since the late 1960s, Middle East danger zones hinged on the differential profits of dominant oil companies; that is, on whether their rate of return beats or trails the corporate average.
Specifically, we claimed that when the differential profits of the oil companies are positive – namely, when they beat the average – the risk of regional conflict is low. And conversely, when their differential profits are negative – i.e., when they trail the average – the region is in a danger zone, and the risk of conflict is high.
Nuts and Bolts
Figure 1 highlights the historical relevance of this claim and shows some of its key regularities. [2] The chart juxtaposes the movements of two distinct variables along with a series of explosion-like markers. Let’s explain each of them in turn.
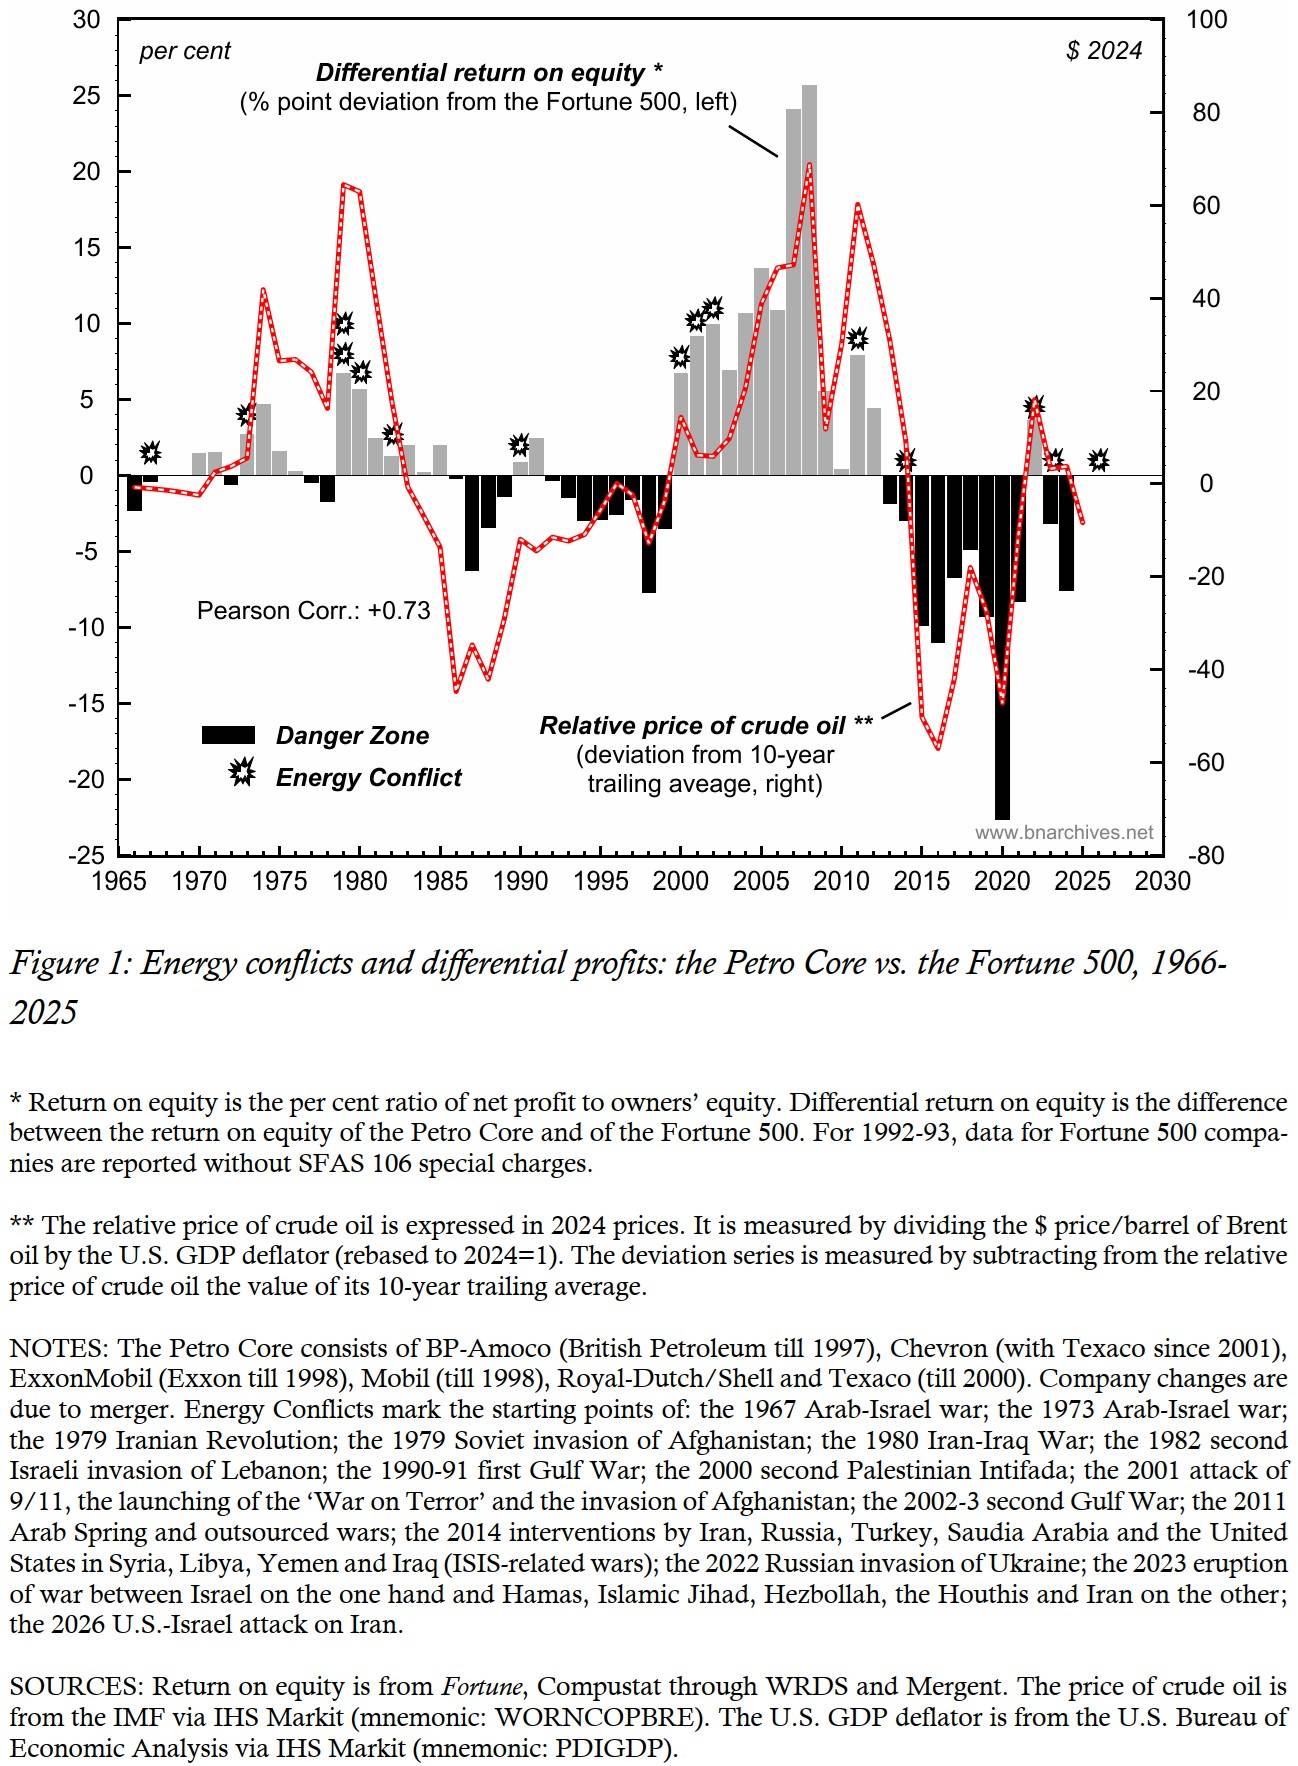
The first variable, plotted as bars against the left scale, depicts the relative performance of a ‘Petro Core’ of leading listed oil companies (named in the figure’s notes). Specifically, it shows the Petro Core’s differential return on equity relative to the average return on equity of the Fortune 500 group of U.S.-based companies. The differential itself, expressed in percentage points, is computed in two steps: (1) by calculating the per cent ratio of net profit to owners’ equity for both the Petro Core and the Fortune 500; and (2) by subtracting the latter from the former. A positive difference (grey bars) means that the Petro Core beats the Fortune 500 average with a higher return on equity. A negative difference (black bars) implies that the Petro Core trails that average, with a lower return on equity.
The second variable, shown as a dashed red series plotted against the right scale, is the change in the relative price of crude oil. This measure is also calculated in two steps: (1) by dividing the dollar price per barrel of Brent oil by the U.S. GDP deflator (rebased to 2024=1); and (2) by subtracting from this result its own 10-year trailing average. The magnitude of this series, expressed in 2024 U.S. dollars, represents the ups and downs in the pricing power of the oil companies (along with OPEC) relative to the pricing power of all U.S. sellers.
Finally, the explosion-like markers indicate the eruption of individual energy conflicts detailed in the figure’s notes.
The chart reveals two important patterns. First, the two variables – the Petro-Core’s differential returns and the changes in the relative price of oil – move tightly together, with a Pearson Correlation coefficient of +0.73 out of a maximum of 1. In other words, the differential return on equity of the large oil companies hinges mostly on their ability to have oil prices rise faster (or fall more slowly) than other corporations raise (lower) theirs.
Second, relative oil prices and differential oil returns both hinge on – and in turn predict – Middle East energy conflicts. As we detail below, these conflicts tend to be preceded by danger zones – namely, stretches of negative differential returns that make oil wars more likely; once a conflict erupts, it tends to raise the relative price of oil; and if and when the rise becomes big enough to switch the Petro Core’s differential returns from negative to positive, the danger zone closes.
The Regularities
Empirically, the chart shows three remarkable regularities.
* First, and most importantly, for more than half a century now, every energy conflict save one was preceded by the Petro Core trailing the average. In other words, generally, for a Middle East energy conflict to erupt, the leading oil companies first must differentially decumulate. [3] The only apparent exception to this rule is the 2011 burst of the Arab Spring and the subsequent blooming of outsourced militia wars in Lebanon, Syria and Iraq – conflicts that were financed and supported by a multitude of governments, NGOs and supreme-god churches in and outside the region. The 2011 round erupted without a prior danger zone – although the Petro Core was very close to falling below the average. In 2010, its differential return on equity dropped to a razor-thin 0.4 per cent, down from around 25 per cent in both 2008 and 2009. (The 2023 eruption of the Gaza war, although preceded by a mini oil boom associated with Russia’s 2022 invasion of Ukraine, came after a very long streak of massive differential oil losses.)
* Second, every energy conflict – with two exceptions: the multiple ISIS-related interventions in 2014 and the 2023-2025 Gaza war – was followed by the oil companies beating the average. In other words, war and conflict in the region – processes that customarily are blamed for rattling, distorting and undermining the aggregate economy – have tended to serve the differential interest of the large oil companies (and OPEC) at the expense of leading non-oil firms (and countries). [4] This finding, however striking, should not surprise us. As Figure 1 shows, differential oil profits are intimately correlated with the relative price of oil; the relative price of oil in turn is highly responsive to Middle East risk perceptions, real or imaginary; these risk perceptions tend to jump in preparation for and during armed conflict; and as risks mount, they raise the relative price of oil and therefore the differential profits of the oil companies and the relative export revenues of OPEC.
* Third and finally, according to our data, the Petro Core never managed to beat the average without a preceding energy conflict. In other words, on this count, the differential performance of the oil companies depends not on production, but on the most extreme exercise of power and sabotage: war.
The Current Moment
Focusing on the most recent wars, we can see that the 2022 Russian invasion of Ukraine came after a prolonged and very deep danger zone, and that this attack managed to raise the relative price of oil along with the Petro Core’s differential return on equity. Consequently, the Middle East was pulled out of its danger zone, but only briefly.
In 2023, the relative price of oil decelerated, and with the Petro Core’s differential return on equity reverting to negative territory, the Middle East once again slid into a danger zone. In October of that year, Hamas and the Islamic Jihad – seemingly on cue from our chart – attacked Israel, launching a new regional war. But the new war – which quickly expanded to include Hezbollah, the Houthis and Iran and drew massive media attention – had only a muted impact on energy prices. Worse still (at least for the oil companies and OPEC), in 2024 the relative price of oil and the Petro Core’s differential returns resumed their decline, sending the region even deeper into the danger zone.
From this perspective, the 2026 joint attack by the United States and Israel on Iran is hardly surprising. As these lines are written, the attack, along with the retaliations by Iran and its proxies, has sent crude oil prices soaring to nearly $100/bbl – their highest level since Russia invaded Ukraine. And if these increases – in absolute terms but mostly relatively to other prices – can be sustained, the Petro Core’s differential returns will likely rise, and the battered Middle East will again be extricated from its danger zone.
Note, though, that since the data in Figure 1 are annual, they reach only till 2025 for the relative price of oil and 2024 for the differential returns of the Petro Core. This limitation is transcended by the somewhat different perspective offered in our closing section below.
A Different Look
Figure 2 examines the process from a global viewpoint, using earnings per share (EPS) reported on a monthly basis. [5] The top two series in the figure contrast the average EPS performance of the world’s listed integrated oil & gas companies with the average EPS performance of all listed companies in world. Each series measures the annual rate of change of the respective EPS, computed by comparing any given month with the same month a year earlier and smoothed as a three-year trailing average.
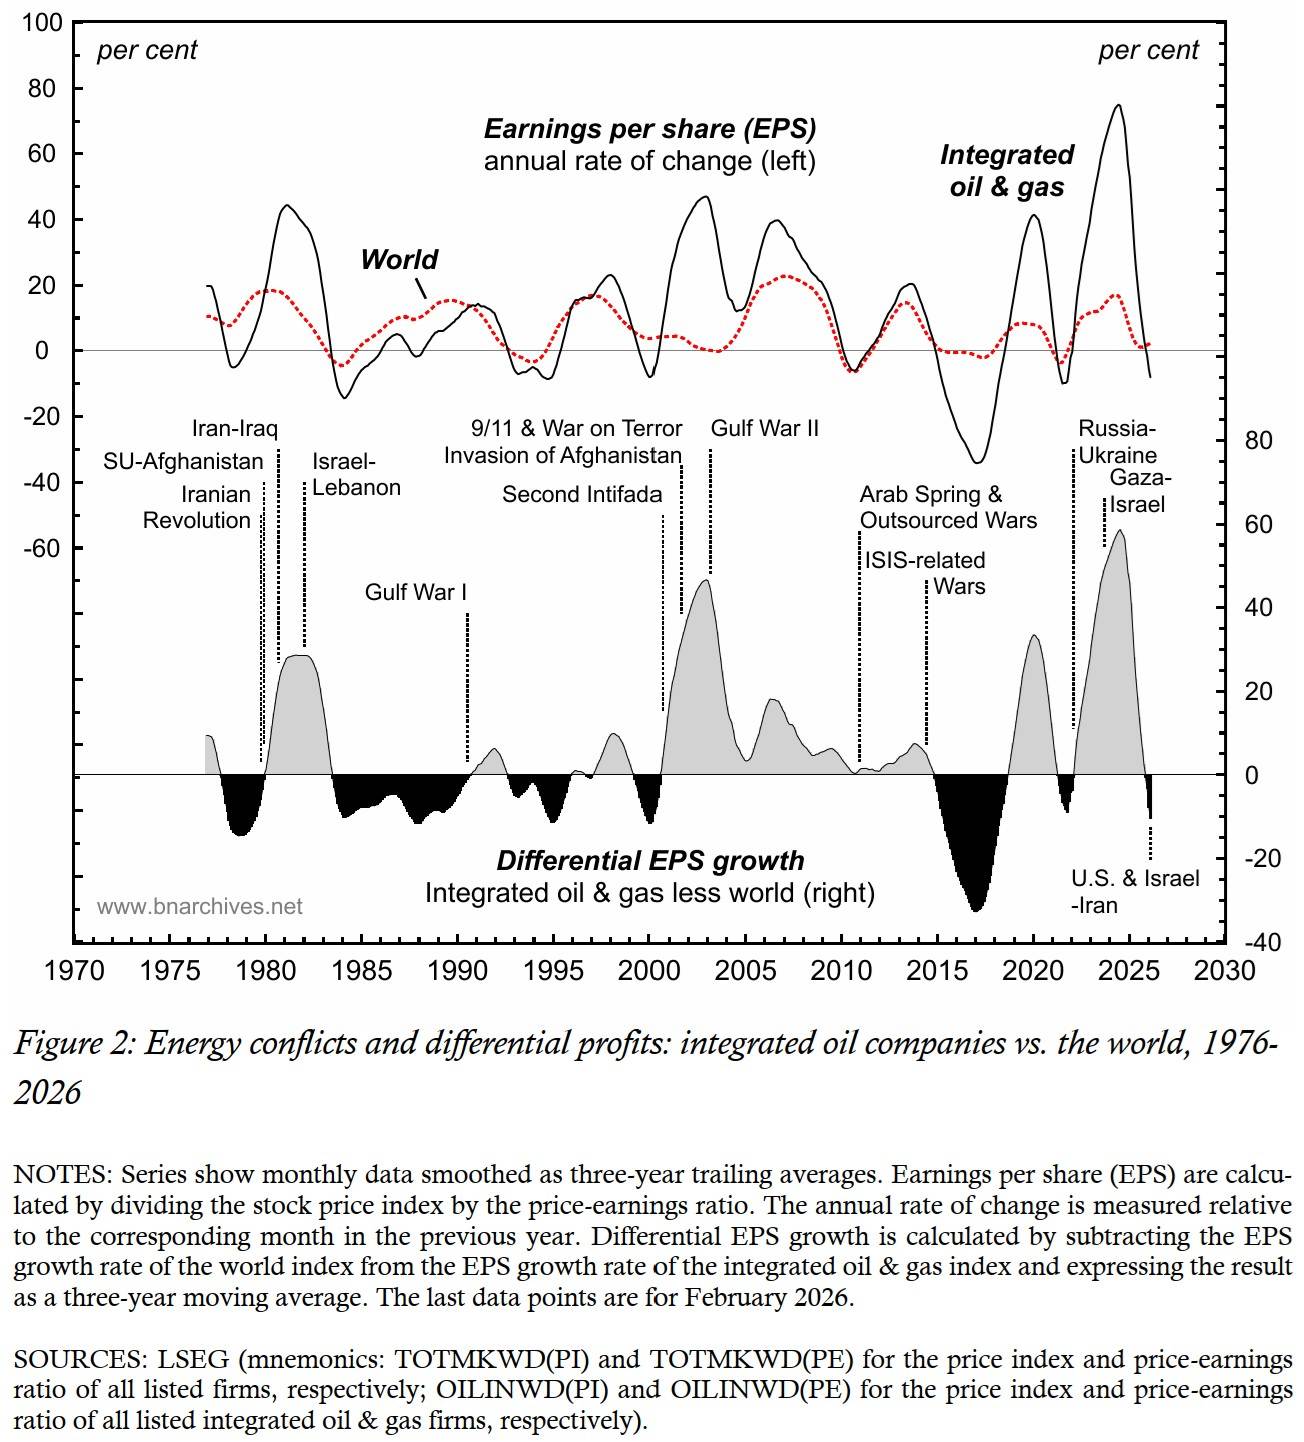
The bottom series shows the differential EPS growth of the integrated oil & gas companies. This series is derived, first, by subtracting the EPS growth rate of the world index from the EPS growth rate of the integrated oil & gas index, and then, by expressing the resulting difference as a three-year trailing average. As in Figure 1, grey areas indicate periods during which the integrated oil & gas companies beat the average (positive differential earnings growth), while black areas show periods in which they trail the average (negative differential earnings growth).
Now, note that, while the energy conflicts here are the same as those listed in Figure 1, the measure of differential profit is different in several important respects. (1) The geographical scope is much wider, and the focus is less on corporate size and more on the type of business activity. Whereas in Figure 1, the comparison is between a Petro-Core of four to six firms and the U.S.-based Fortune 500, here the comparison is between all the world’s listed integrated oil & gas companies and the world average for all listed companies. (2) The profit metric is different. Whereas in Figure 1, the proxy of choice is return to equity, here it is earnings per share (EPS). (3) The nature of the variables is different. While in Figure 1 we look at levels, here we examine rates of change. (4) The temporal presentation is more refined. Whereas in Figure 1 the data are annual, here they are monthly, expressed as three-year trailing averages. And (5), the period under examination is shorter – in Figure 1 it starts in 1966, while here the data begin in 1973 (and in 1976 for the three-year trailing averages).
All in all, then, our proxy for differential profits in Figure 2 is very different from the one we use in Figure 1. Yet the stylized patterns – as well as the exceptions to those patterns – are almost the same!
Similarly to Figure 1, the chart shows that, since 1976 (1) all energy conflicts were preceded by the world’s integrated oil companies suffering negative differential earnings growth (with the exception of the 2011 Arab Spring / outsourced wars and the 2014 ISIS-related conflicts, when this differential was very close to zero, but still positive); (2) all conflicts were followed by the integrated oil companies experiencing positive differential earnings growth; and (3) except for the mid-1990s (and in this chart also 2019-2021) the integrated oil companies have not managed to beat the average without a prior energy conflict.
Also, the monthly correlation between differential EPS growth and the rate of change of the relative price of oil (+0.72, as shown in Bichler and Nitzan 2023: Figure 2) is virtually the same as the one shown for the annual differential returns and relative oil price deviations in Figure 1 (+0.73).
Finally, the relations in this figure between the recent energy conflicts and differential oil earnings are the same as those shown in Figure 1: the danger zone in 2021-2022 closed once Russia’s invasion of Ukraine raised relative oil prices and boosted the differential earnings of oil & gas companies; the effect of the 2023 Gaza War on relative oil prices and differential earnings was initially muted and then decelerated sharply; and finally, in 2026, a few months after the differential earnings growth of oil & gas companies turned negative, the United States and Israel attacked Iran.
Today’s dominant capitalists, top state officials and supreme-god clerics believe they run the world. But, in the end, they too, just like their subjects, seem dancing to the all-imposing tune of differential earnings and capitalized power.
Endnotes
[1] Shimshon Bichler teaches political economy at colleges and universities in Israel. Jonathan Nitzan is an emeritus professor of political economy at York University in Canada. All their publications are available for free on The Bichler & Nitzan Archives (https://bnarchives.net). Work on this paper was partly supported by SSHRC.
[2] The first version of this chart appeared in Nitzan and Bichler (1995: Figure 10a, p. 499). Our current description of Figure 1 follows and updates the account in Bichler and Nitzan (2024).
[3] In the late 1970s and early 1980s, and again during the 2000s, differential decumulation was sometimes followed by a string of conflicts stretching over several years. In these instances, the result was a longer time lag between the initial spell of differential decumulation and some of the subsequent conflicts.
[4] A key point to note here is the effect of energy conflicts not on absolute but differential oil returns. For example, in 1969-1970, 1975, 1980-1982, 1985, 1991, 2001-2002, 2006-2007, 2009 and 2012, the rate of return on equity of the Petro Core fell; but in all of these cases the fall was either slower than that of the Fortune 500 or too small to close the positive gap between them, so despite the absolute decline, the Petro Core continued to beat the average.
[5] For an early version of this chart, see Bichler and Nitzan (2015: Figure 5, p. 66). Our examination here updates the discussion in that article.
References
Bichler, Shimshon, and Jonathan Nitzan. 2015. Still About Oil? Real-World Economics Review (70, February): 49-79.
Bichler, Shimshon, and Jonathan Nitzan. 2023. Blood and Oil in the Orient: A 2023 Update. Real-World Economics Review Blog, November 10.
Bichler, Shimshon, and Jonathan Nitzan. 2024. The Road to Gaza, Part II: The Capitalization of Everything. Real-World Economics Review (109, November): 18-28.
Nitzan, Jonathan, and Shimshon Bichler. 1995. Bringing Capital Accumulation Back In: The Weapondollar-Petrodollar Coalition -- Military Contractors, Oil Companies and Middle-East "Energy Conflicts". Review of International Political Economy 2 (3): 446-515.